Archives
- April 2015 (1)
- January 2012 (1)
- October 2011 (1)
- March 2011 (1)
Categories
- fantasy baseball (1)
- fantasy basketball (3)
CC license

This work is licensed under a Creative Commons Attribution-NonCommercial-ShareAlike 3.0 Unported License.
Fantasy Basketball – Solver for Draft Optimization
In the last post, I shared my rankings and how they were derived. Great, but the question remains, what is the best team money can buy in an auction draft?
Excel and Open Office come with a Solver tool, it’s capable of linear optimization, or maximizing a value Y with a budget constraint X.
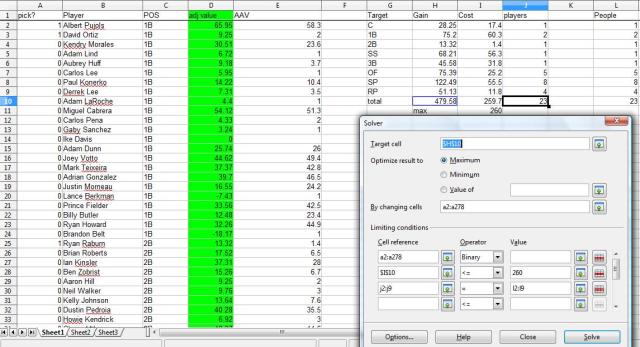
Below is a list of each player, their average cost, their estimated value, and how many of each position I want/need.
Below is how I set up solver
This gave a team that is much better than a lot of teams drafted. If you draft against a completely average set of opponents, consider yourself lucky. Enjoy.
Posted in fantasy basketball
1 Comment
Fantasy Football Rankings
I realize I never made a post on ranking Fantasy Football players. This post shows how to use a player’s past seasons to project their points in the upcoming season.
Step 1: Weighing past seasons
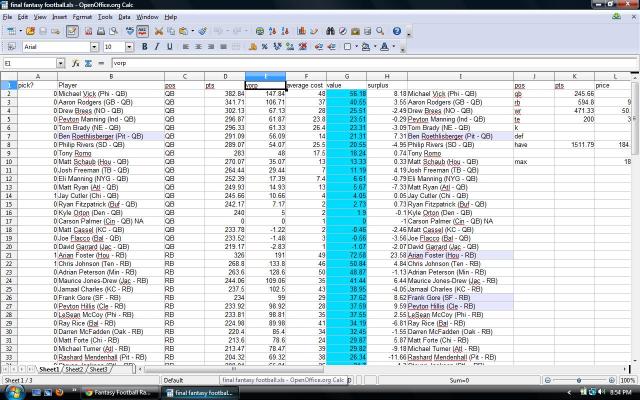
I took the top draft-worthy players’ stats from the past 2 seasons. I then created a very simple formula to project this season.
Projected points = .66*last year points + .33*points from 2 years ago
Step 1A: per-game adjustment
Some of the players may have missed a number of games, and I like to adjust their projected points to assume that they’ll play 16 games. Injury history should be considered, but I want to rank the players by their talent, not the amount of games they played in.

For example, if Frank Gore only played in 13 games last year, I would multiple his season total in points by (16/13) to get an estimate of how he WOULD have done without the injury. These rankings may be biased toward injury-prone players that can hurt a team, so depth shouldn’t be ignored.
Step 2: Define the replacement level player
In a 10-team league, each team has 3 starting WRs and probably 2 benched WRs. Assuming the top 50 WRs are owned, that means that the 51st best WR is going to be available on Free Agency, and doesn’t need to be drafted. I took an average how many points the 51st best WR scored in each of the past 3 years to get a general idea of the quality of player that would be available as a replacement at about anytime in the season. Doing this for each position gives you an idea of how many points you can get from a non-drafted player.

Step 3: Subtract each players projected points by their positional replacement level
In my rankings, Ryan Fitzpatrick was projected to be worth 242 points, and the replacement level QB was worth 235 points. Fitzpatrick was then worth 7 points Value over Replacement Player, or he had a VORP of 7.
Step 4 (for auction leagues): Creating a $ value from VORP
To give a player a $ value, you have to find his value as a factor of VORP
In my league, there are 10 teams, each with $200. 10 x $200 = $2000 in the fantasy economy.
So you just need to figure out the conversion rate from 1 VORP to $1.
In all the draftable players I researched, their VORP summed to a combined 4500.
VORP * x = $
2000/4500 = .44 $/VORP
So a player with a VORP of 1 is worth about 44cents.
Step 5 (auction leagues): Find undervalued players
Yahoo posts the average cost of each player.
Value – Average Cost = Surplus Value.
This is how I identified and targeted players that were going for cheaper than they should. Ex. Antonio Gates

Step 6: Run Solver
In the spreadsheet, I set up Excel Solver as I did in a past baseball post. The steps to this are a even more dry and technical that previous steps, so they can be elaborated on if anyone cares to hear it.
Basically Excel Solver can maximize value with a constraint of $185 to spend on 1 QB, 2 RB, 3 WR, 1 TE (I left $15 over to pay for a bench)
It spit out a team such as
Vick, A Foster, BenJarvis, Andre Johnson, Desean Jackson, Stevie Johnson, Antonio Gates.
I like that team.

These values can be valuable tools for drafting and trading. The biggest mistake you could make however would be to follow the projected points without considering the context of the numbers. For example, teams that have fallen a great ways from the previous years, like the Colts, will have players overvalued by a system that doesn’t take into account Peyton’s season ending injury. Go with the numbers AND your gut, never just one.
I’ve attached a spreadsheet showing some of the projected values I calculated using this method. Enjoy!
Posted in fantasy basketball
3 Comments
Fantasy Team Optimization Using Linear Solver
For fantasy baseball drafts, leagues have a choice between a traditional draft in which teams choose players in order, or an auction draft so that each team can bid on every player. With a $260 budget, the goal is to maximize the number of valuable players while choosing a player at every necessary position.
Regardless of whether you calculated values or took them from somewhere (for example, baseballmonster.com), let’s say you have estimated dollar values and the average price for each player. How do you choose who to target?
To get a good approximation, create a spreadsheet with a row for each: player, his position, his value, his market price, and a blank row. The blank row is a representation of whether the player goes on your team or not. So the only numbers in it are binary, 0 and 1. After that the steps are, well, it might be easier to take a look at the spreadsheet.
Set it up similarly so that you can play with adding/dropping players from your team. Then you can set up solver with the conditions as shown below. They ensure that you
1) maximize your estimated dollar value
2)choose the players on your team to do so
3) choose only the same number of players at each position as indicated.
Looks like I can get $480 of estimated value on a budget of just $260.
One caveat to note is that this does not account for UTIL players which can be from any position. This assumes a OF spots, there are decent values there for cheap. I also set arbitrary #s for the pitchers. I prefer having 4 closers to lock up saves usually, but may go for 5 if it doesn’t sacrifice other position depth.
Remember, follow solver’s optimization only as a guide, you should be flexible given that each draft will diverge from the average draft in many different ways. Get your targets early on and save money for when your opponents have run out of money. Cheers.
Posted in fantasy baseball
Leave a comment


